OZ Pitch Day - June 13, 2024
Novogradac: QOF Fundraising Growth Rate Up Year-Over-Year Despite Q2 Slowdown
According to new data from Novogradac, capital raising by Qualified Opportunity Funds slowed in the second quarter of 2022, compared to Q1, as broader markets slumped and inflation hit four-decade highs.
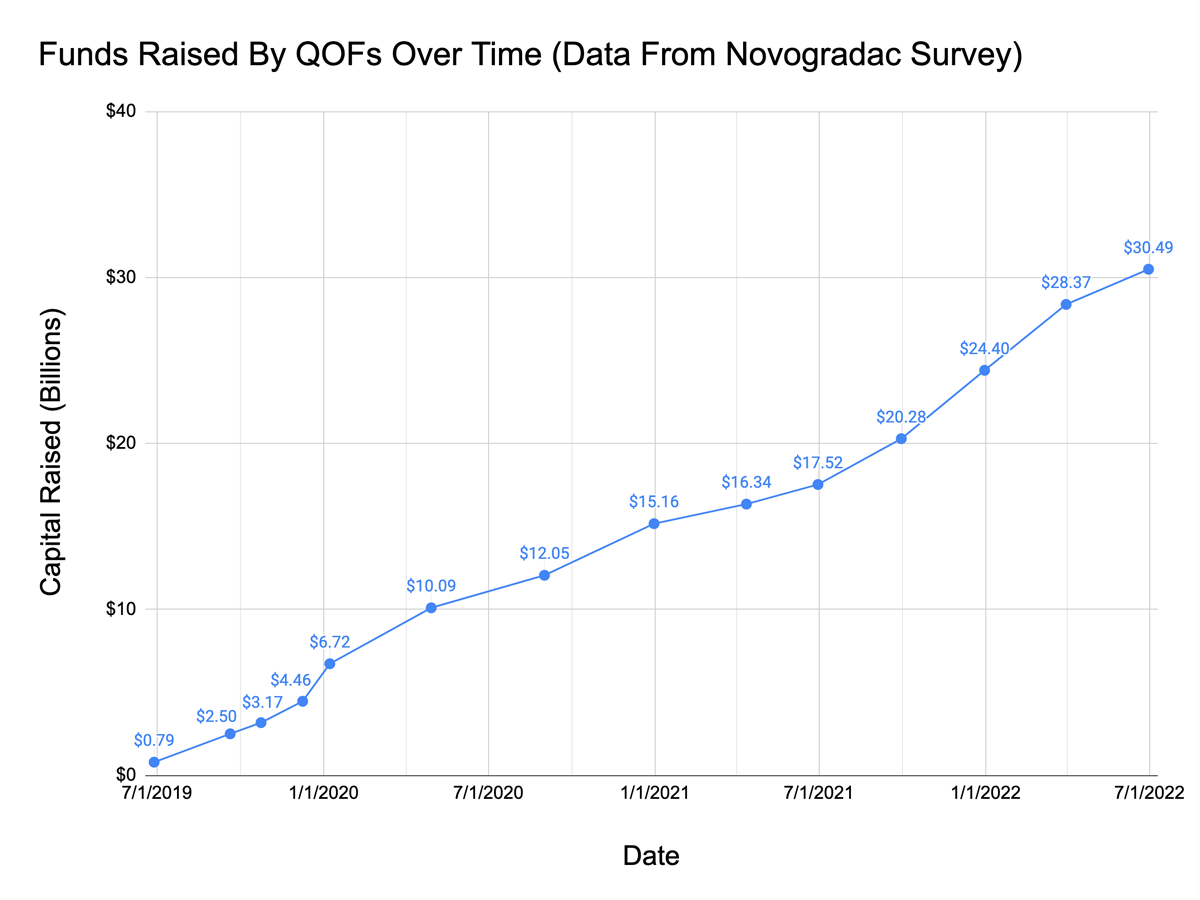
As of June 30, 2022, Qualified Opportunity Funds participating in Novogradac’s voluntary survey of the industry reported a total of $30.49 billion in capital raised since program inception in 2018. That was an increase of $2.12 billion over the course of the quarter, a slowdown in growth compared to the previous quarter (ending March 31, 2022), which experienced a $3.97 billion increase.
But year-over-year, the fundraising pace has actually increased. The second quarter in 2021 showed an increase of just $1.18 billion.
Comparing six-month periods, the six-month start to this year has seen $6.09 billion in fundraising, compared to just $2.36 billion during the same January-thru-June six-month period in 2021.
“As the OZ investment incentive matures, investor interest is not waning,” said managing partner Michael Novogradac. “Investors continue to invest equity capital in opportunity zones, thereby helping provide economic and other benefits and opportunities for residents and businesses in distressed areas.”
Novogradac’s survey is not comprehensive. Because Novogradac is only able to survey a portion of the total QOF universe that self reports directly to Novogradac or reports to the SEC, the $30.49 billion reported is only a fraction of the total amount of capital raised by all Opportunity Zone funds. Novogradac estimates that the actual total is likely three to four times greater that what gets captured in the Novogradac reports, which would put the total amount of capital raised for Opportunity Zones in the range of $90 billion to $120 billion.
Novogradac QOF Survey Reporting History
| Reporting Period End Date | Total Funds Raised (Billions) | Number Of QOFs Reporting Funds Raised | Funds Raised During Period (Billions) | Days In Reporting Period | Funds Raised Per Day (Thousands) |
|---|---|---|---|---|---|
| 6/28/2019 | $0.79 | 28 | $0.79 | 365 | $2.16 |
| 9/20/2019 | $2.50 | 57 | $1.71 | 84 | $20.36 |
| 10/24/2019 | $3.17 | 112 | $0.67 | 34 | $19.71 |
| 12/9/2019 | $4.46 | 184 | $1.29 | 46 | $28.04 |
| 1/8/2020 | $6.72 | 292 | $2.26 | 30 | $75.33 |
| 4/29/2020 | $10.09 | 406 | $3.37 | 112 | $30.09 |
| 9/1/2020 | $12.05 | 580 | $1.96 | 125 | $15.68 |
| 12/31/2020 | $15.16 | 659 | $3.11 | 121 | $25.70 |
| 4/12/2021 | $16.34 | 708 | $1.18 | 102 | $11.57 |
| 6/30/2021 | $17.52 | 853 | $1.18 | 79 | $14.94 |
| 9/30/2021 | $20.28 | 909 | $2.76 | 92 | $30.00 |
| 12/31/2021 | $24.40 | 978 | $4.12 | 92 | $44.78 |
| 3/31/2022 | $28.37 | 1,035 | $3.97 | 90 | $44.11 |
| 6/30/2022 | $30.49 | 1,097 | $2.12 | 91 | $23.20 |
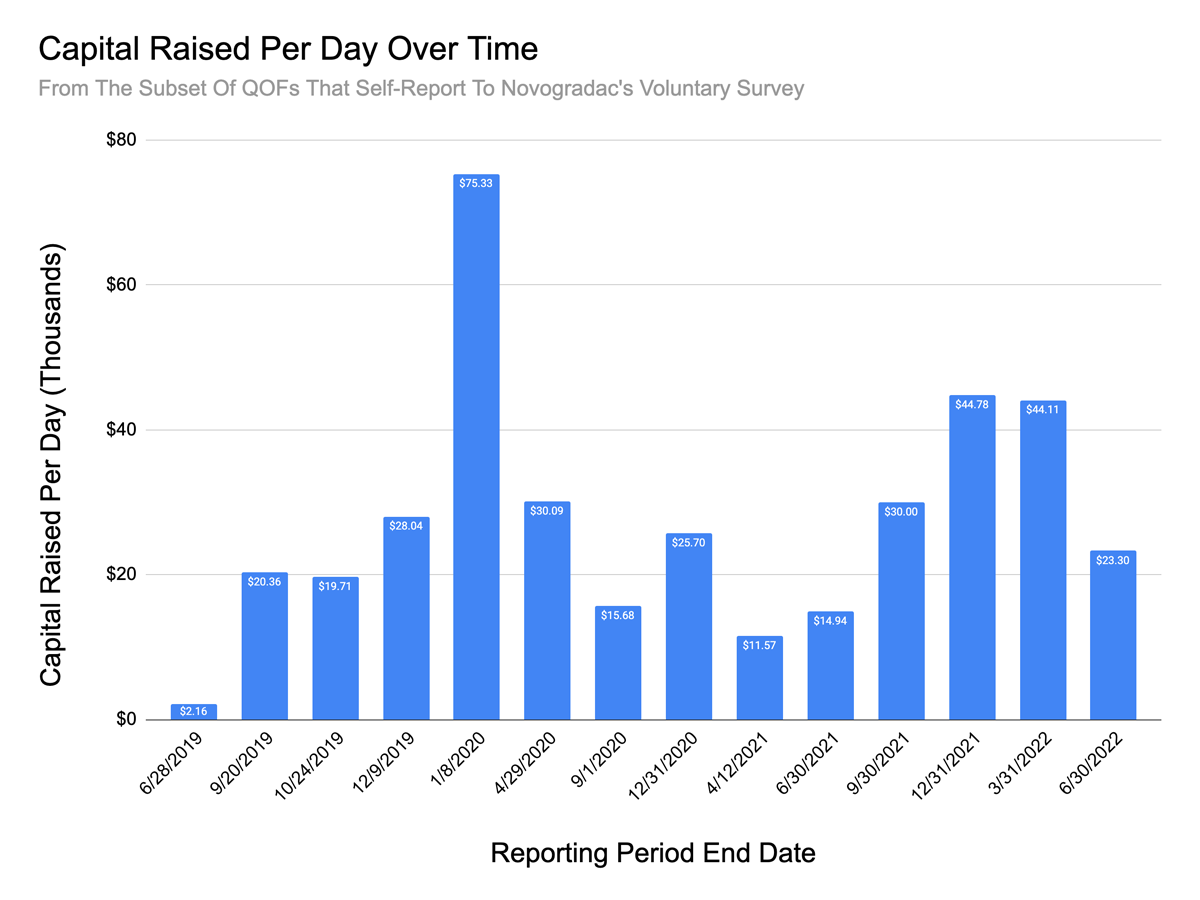
Novogradac has conducted their rolling survey since May 2019. But their reporting periods were irregular until last year, when they started issuing data based on quarter-end figures.
To account for these irregular periods, we can compare data using a funds raised per day metric, which divides funds raised during period by days in reporting period. Doing so provides a better look into how the pace of fundraising has changed over time, as indicated visually in the chart below. Note the spike on the January 8, 2020 reporting period, which took into account a flurry of fundraising just prior to the year-end 2019 deadline to receive a 15-percent basis step-up.
More From Novogradac
An updated in-depth “Opportunity Zones Investment Report” is available for purchase from Novogradac.
Listen: Michael Novogradac and John Sciarretti discuss the new data on the Tax Credit Tuesday Podcast.